Report design

Annual and sustainability report design that people actually read
An annual report carries a full year of your company’s work. A sustainability report carries its credibility. Both deserve better than to be skimmed for thirty seconds and closed.
We design annual reports, sustainability and ESG reports and corporate publications that turn dense data into a document people read to the end: clear structure, honest data visualisation, and a design that respects the reader’s time.
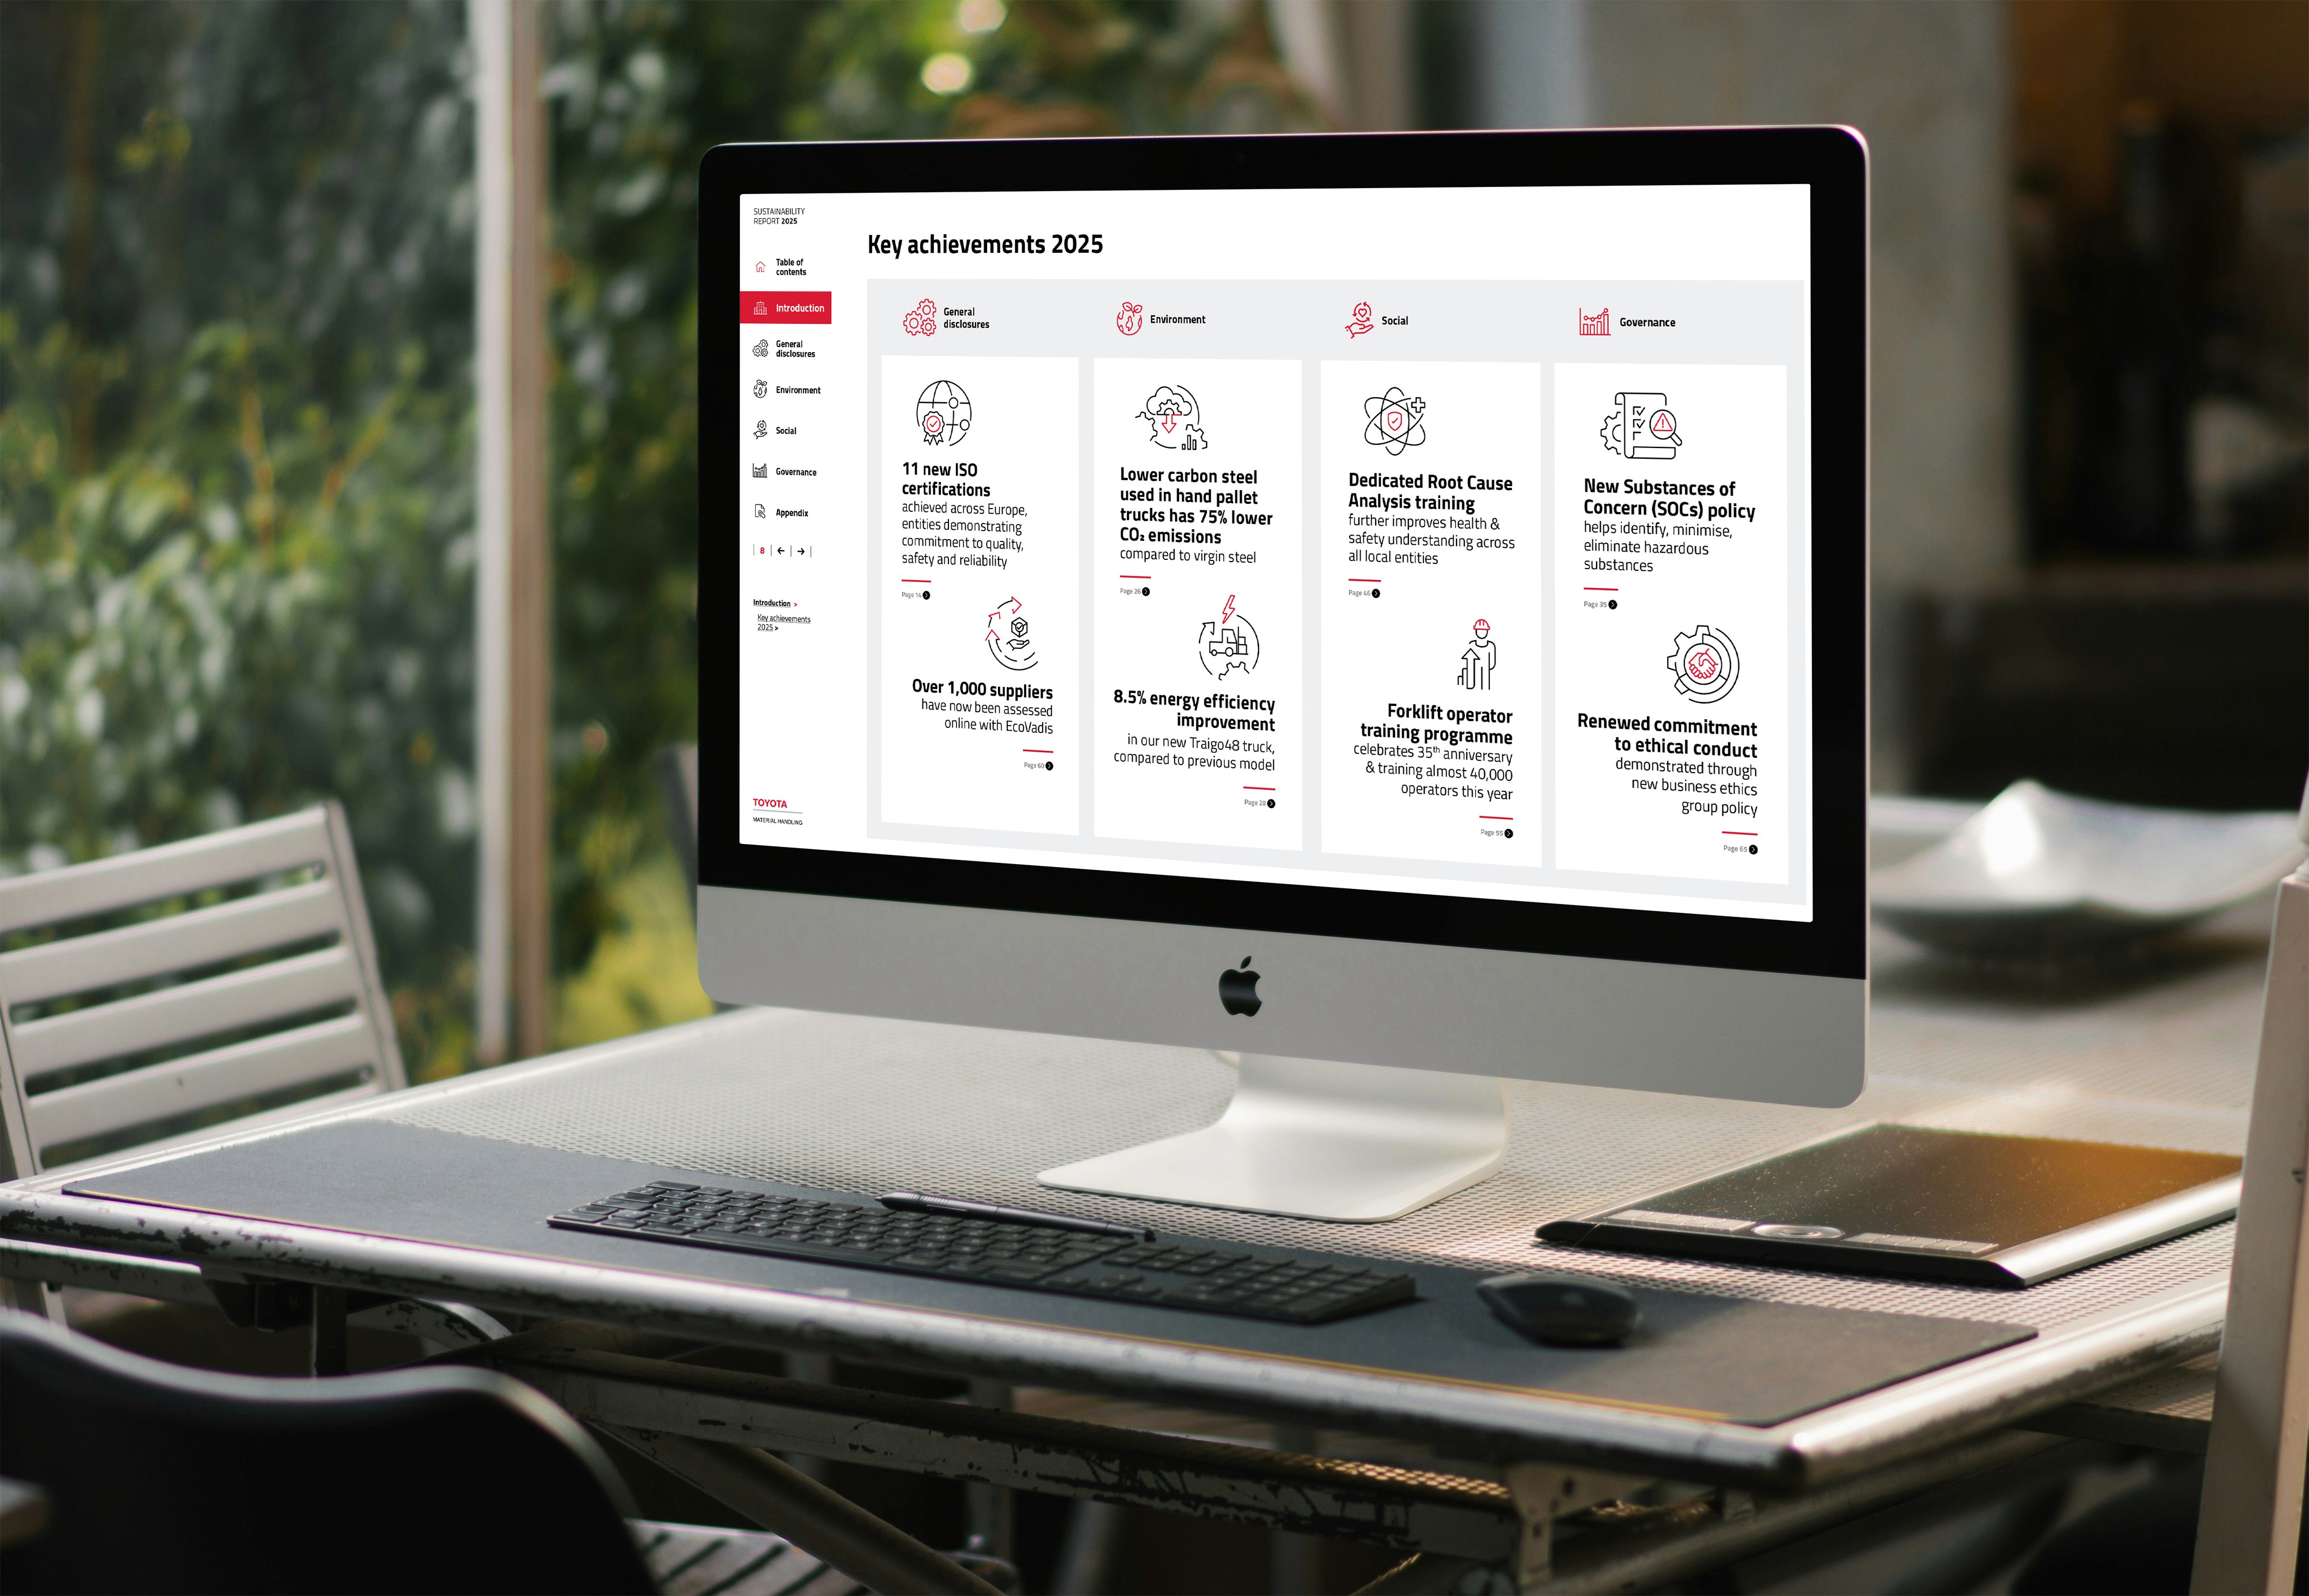
We have designed Toyota Material Handling Europe’s sustainability report nine years in a row. Companies do not hand you that report a ninth time unless the first eight held up.
Reports are read differently these days
A report used to be written for one audience, printed once and filed. That world is gone.
Today the same document is read by investors, customers, regulators, journalists, your own employees and the candidates deciding whether to join you, and most of them read it on a screen, jumping to the section that concerns them. Sustainability reporting gets particular scrutiny: readers arrive sceptical, looking for substance behind the statements.
Design is what decides whether they find it. A report where the structure is clear, the numbers are visualised honestly and the story is easy to follow reads as a company in control of its facts. A wall of text with a stock photo of a wind turbine reads as a box being ticked, and readers can tell the difference in seconds. The content teams pour months into deserves the first kind of treatment.
Our Approach
What we design
Simple steps. Clear thinking. Strong results.
We are a small senior team in Mechelen, Belgium, working with international manufacturers and energy and infrastructure companies across Europe, the US and the Middle East. More than twenty years in.


01/
Annual reports
The full year in one document: financials, strategy, milestones, governance. We design the structure first, so a reader can find the section they came for, then give every page a clear hierarchy so the key figures and messages surface instead of drowning.
02/
Data visualisation and infographics
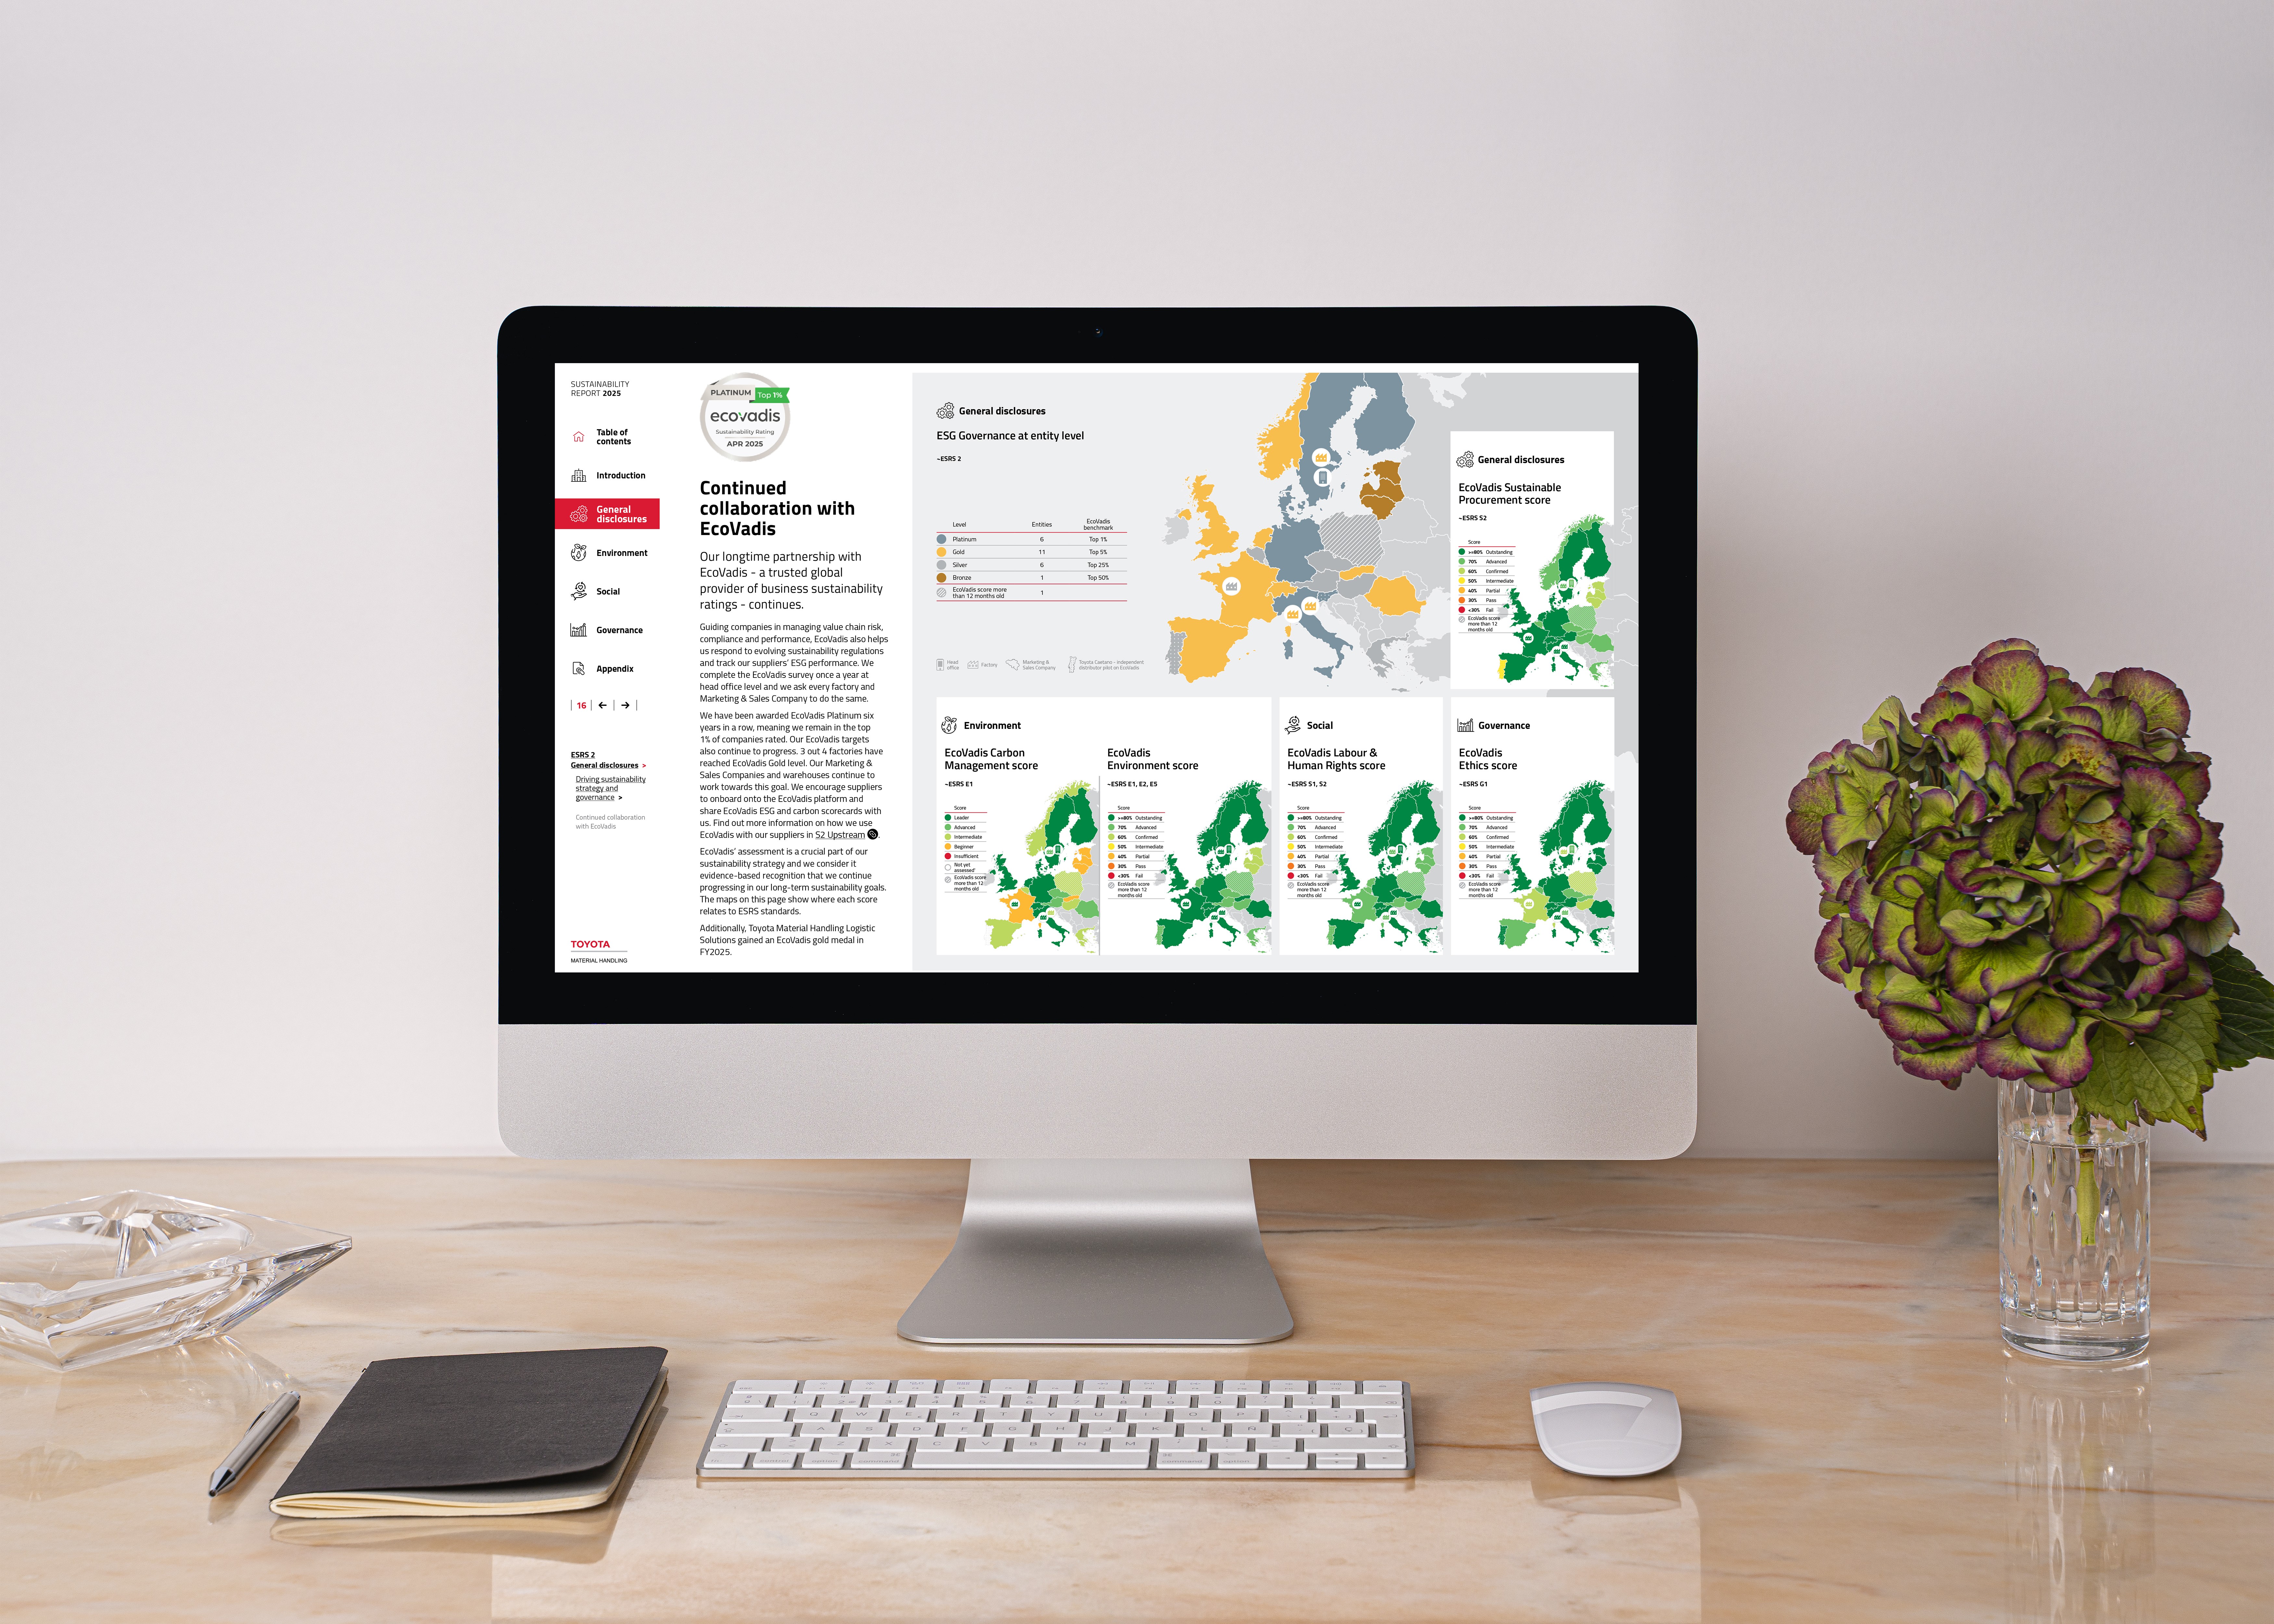
Numbers carry most of a report’s weight, and tables make readers work for them. We design charts, infographics and visual summaries that make a trend legible at a glance and stay accurate under scrutiny. No decorated numbers, no charts that flatter. If a figure looks better than it is, the visualisation is wrong.
03/
Sustainability and ESG reports
The hardest reports to design well, because the material is dense, the frameworks are demanding and the audience is critical. Our job is turning complex sustainability data into a clear, engaging story without softening it: emissions, targets, progress and gaps, presented so a reader can judge them fairly.
04/
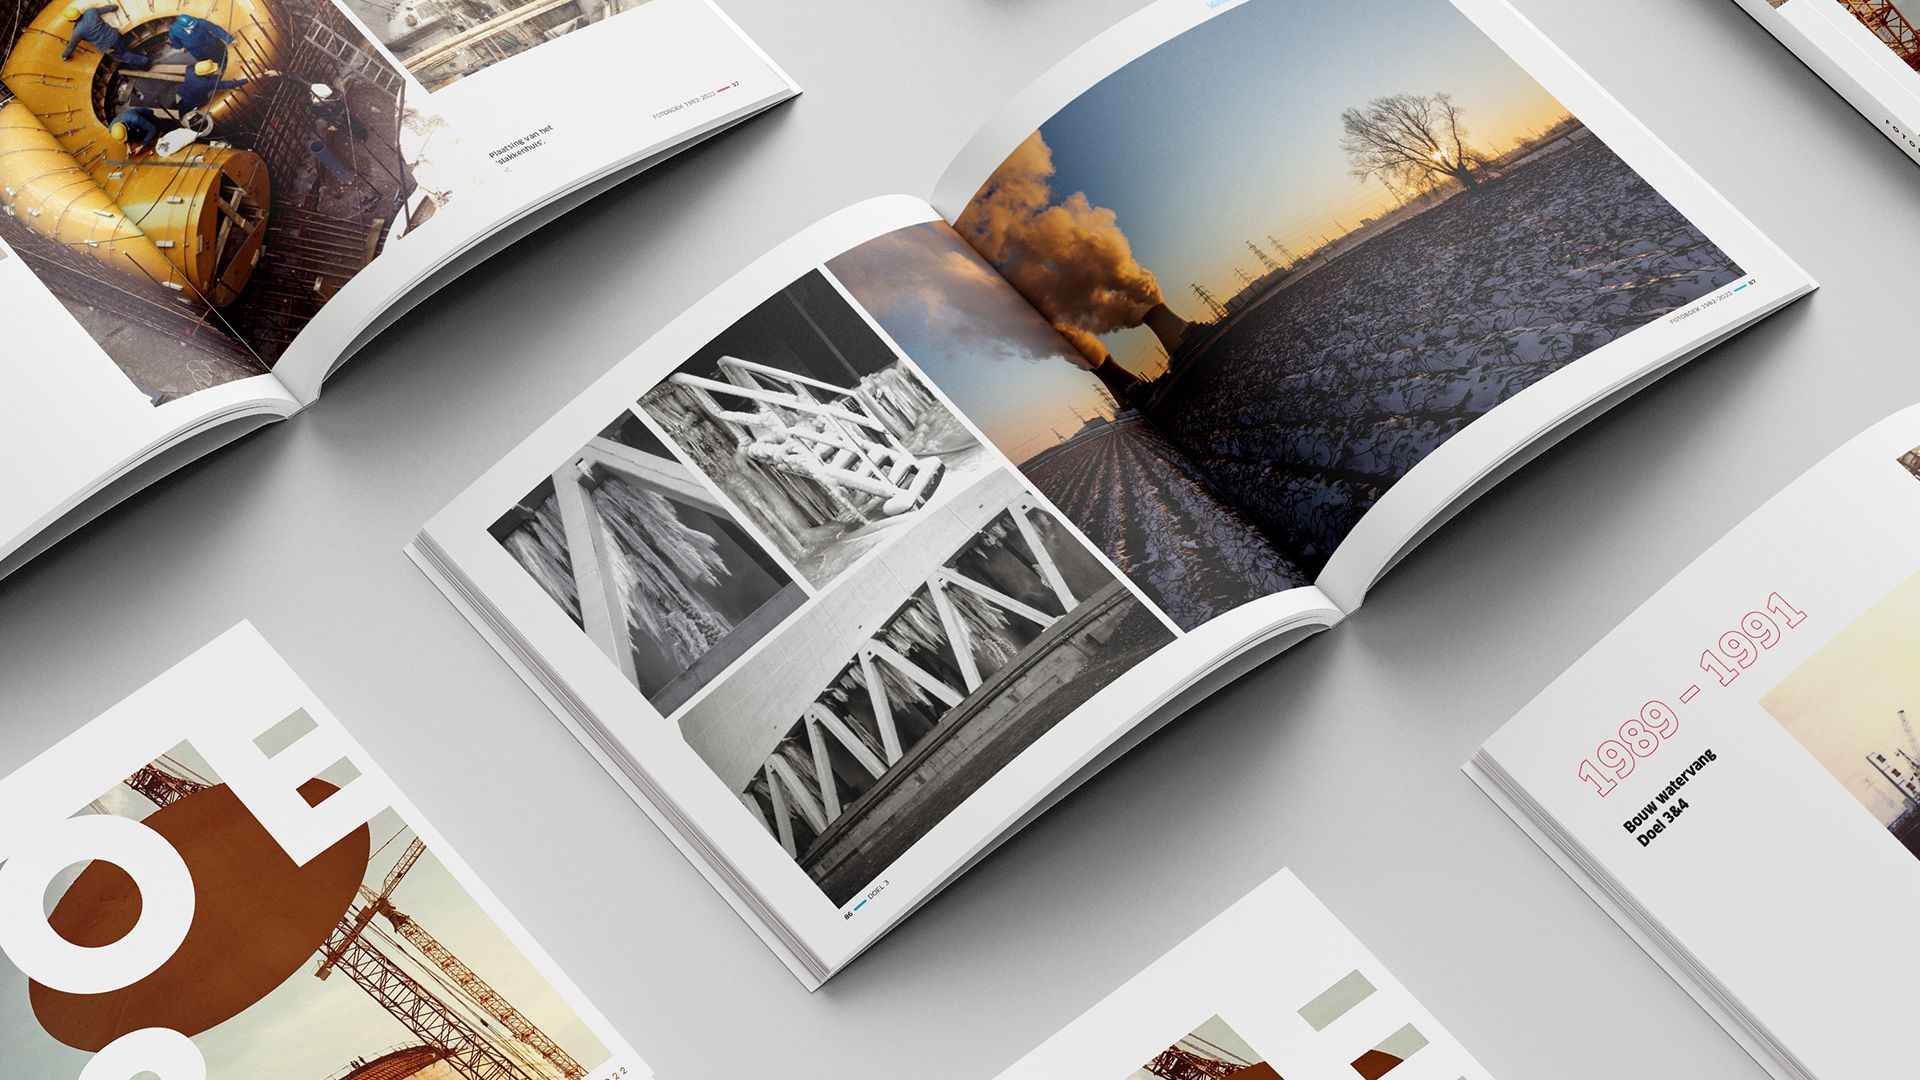
Corporate publications and commemorative books
Corporate publications and commemorative booksThe hardest reports to design well, because the material is dense, the frameworks are demanding and the audience is critical. Our job is turning complex sustainability data into a clear, engaging story without softening it: emissions, targets, progress and gaps, presented so a reader can judge them fairly.
Print, digital or both
Print still earns its place: an annual general meeting, a customer visit, a book meant to sit on a table for years. But most reading now happens on screens, so we design for both from the start, one design system producing the printed document and the digital experience, instead of one PDF asked to do two jobs.
What you'll get
A finished, publication-ready report. Not a template filled in, but a document designed around your content: the structure, the typography, the data visualisation, the photography direction and the layout of every page, delivered in the formats you publish in. Print-ready files for the press, a digital version built for how people read on screens, or both from the same design.
You also get a partner who has done this before and will do it again next year. Reporting is a cycle, and a designer who knows your data, your brand and your review process from last year saves you weeks on the next edition. That is why our reporting relationships run long.
Proof: nine years, one report
Toyota Material Handling Europe publishes a sustainability report that is read across a continent, by customers, partners and its own organisation.
Our Approach
How we work with your team
We handle dense material comfortably. Emissions data, safety statistics, financial tables, technical operations. Our clients run forklifts, power plants and industrial sites, and their reports are full of exactly this. We are at our best when the content is hard.
01/
Content and data intake
You bring what you have, in the state it is in: draft texts, spreadsheets, last year’s report, the reporting framework you follow, brand guidelines. We do not need a polished manuscript to start. We read it, ask the questions that shape the structure, and agree the scope and the publication date, because everything plans backwards from that date.
02/
Structure and design concept
Before any page gets laid out, we propose the structure and the design direction: how the report flows, how sections are signposted, what the visual language is and how it relates to your brand. You approve the concept on a few representative spreads, so the big decisions are settled before eighty pages exist.
03/
Data visualisation
We take your raw figures and turn them into charts and infographics that are accurate first and attractive second. Your data owners check every visual against the source numbers, because a beautiful chart with a wrong figure does more damage than no chart at all.
04/
Layout and review rounds
Then the full document takes shape, page by page, in review rounds planned around your sign-off process. Reports have many stakeholders and late changes are a fact of life; we build the schedule to absorb them rather than pretending they will not come.
05/
Production and delivery
Print-ready files checked with the printer, digital formats tested on real screens, and source files organised so next year’s edition starts from a working base instead of from zero.
Accuracy survives the process. Reports get audited, quoted and held against you. Our review rounds keep your data owners in the loop at every stage, so what gets printed is what they signed off.
You work with the people doing the work. No account layer, no handovers. The person you brief is close to the person designing your pages, which is why details survive from the first draft to the printed copy.
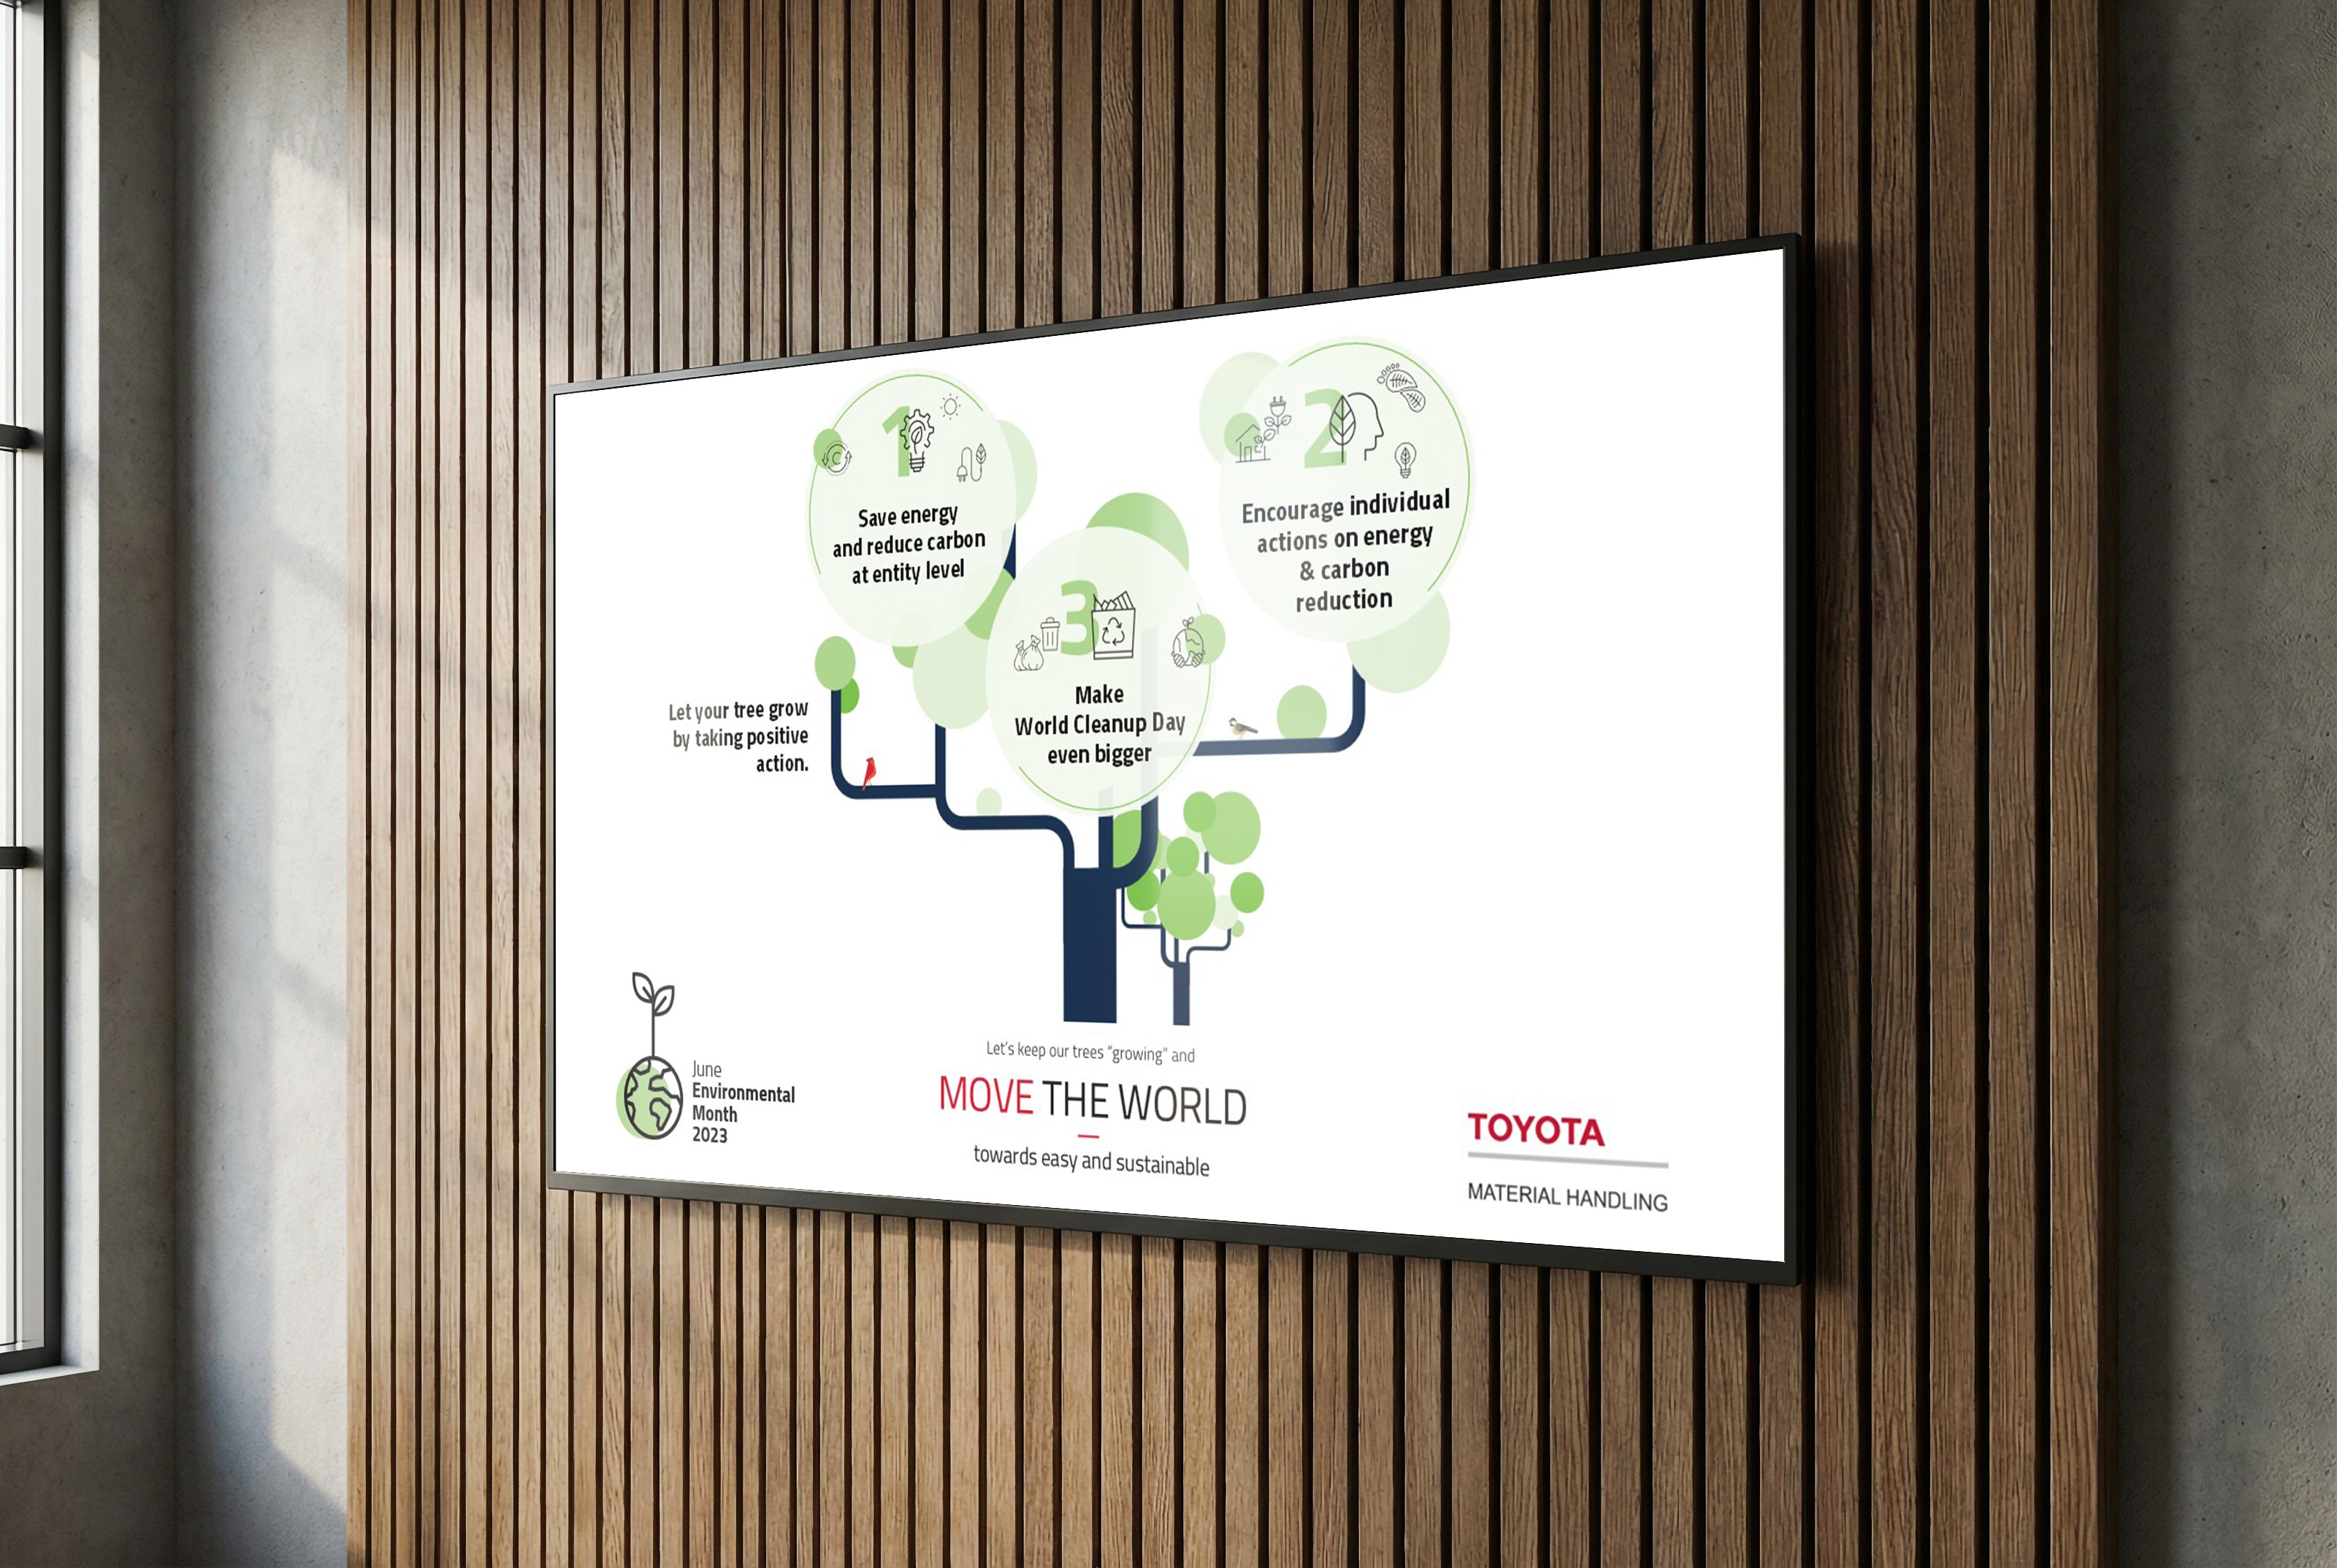
The relationship compounds. Year two is faster than year one, and year nine runs like clockwork. We know, because we are living it with Toyota.
If your report also needs a broader look at your visual identity, that is its own discipline and we do that too: brand and creative design.



Frequently Asked Questions
What does annual or sustainability report design cost?
The main cost drivers are page count, the amount of data visualisation, whether you publish in print, digital or both, and how many language versions you need. We scope it against your project and give you a fixed quote before we start.
How long does report design take?
That depends on the scope, so the work is phased: a launch, AGM or publication date is a fixed point we plan backwards from. The design concept can start from draft content, so design and writing run in parallel rather than in sequence, and the schedule is built around your internal review and sign-off rounds, because those, not the design, usually set the pace. Talk to us early; the projects that feel calm are the ones that started before the content was final.
Do you design sustainability and ESG reports specifically?
Yes, and it is the reporting work we do most. We have designed Toyota Material Handling Europe's sustainability report nine years in a row, which means nine cycles of sustainability data, framework requirements and stakeholder review. ESG material is dense by nature; the design job is making it clear without making it look easier than it is.
Do you design for print, digital or both?
Both, from one design system. Print-ready files for the press and a digital version designed for on-screen reading, not a PDF doing double duty. Most reports today are read on screens by people jumping to the section that concerns them, so the digital version gets designed for that behaviour, with navigation and structure that respect it.
Do you do data visualisation and infographics?
Yes, it is a core part of the work. Charts, infographics and visual summaries built from your source figures, checked by your data owners against the numbers. The standard is simple: accurate first, attractive second, and never a visualisation that makes a figure look better than it is.
Can you work from our raw data and drafts?
Yes, and most projects start exactly there: draft texts in Word, figures in spreadsheets, last year's report and a deadline. You do not need to prepare anything special for us. We take the content in whatever state it exists, propose the structure, and keep your team in the review loop as it becomes a designed document.
Can you handle the report year after year?
That is the model we prefer, and the Toyota relationship shows why: nine consecutive editions, each faster and smoother than the last, because the structure, the data sources and the review process are known quantities. We keep organised source files between editions, so every new cycle starts from a working base.
If a report, a publication or a book is somewhere on your calendar, the best moment to talk is before the content is final. Send us the outline, last year’s edition or just the deadline, and we will tell you what the design work involves, what it costs and when we would need to start. If your timeline is tight, say so; we know where the time goes.